|
|
The Inflation Reduction Act and U.S. Business Investment
08/16/2023
Eric Van Nostrand, Acting Assistant Secretary for Economic U.S. Department of the Treasury The Inflation Reduction Act (IRA)—signed by President Biden one year ago—is the largest climate investment in U.S. history, designed to mobilize private capital to achieve our climate goals and strengthen long-term growth. The IRA encourages innovation by giving firms various demand- and supply-side incentives to invest in developing and deploying clean energy technologies. Furthermore, for several key investments, the IRA provides additional place-based bonuses for companies to locate in underserved communities where job creation will have the largest impact on the well-being of those communities, and where such investments can produce higher economic returns.[1] The IRA is a prime example of what Secretary Yellen calls “modern supply-side economics”: the use of government action to promote growth while addressing climate change or inequality. It will take decades before the full effects of the IRA on the economy and the climate will become clear. But one year after President Biden signed the IRA, we observe two key trends that the IRA is designed to encourage and strengthen:
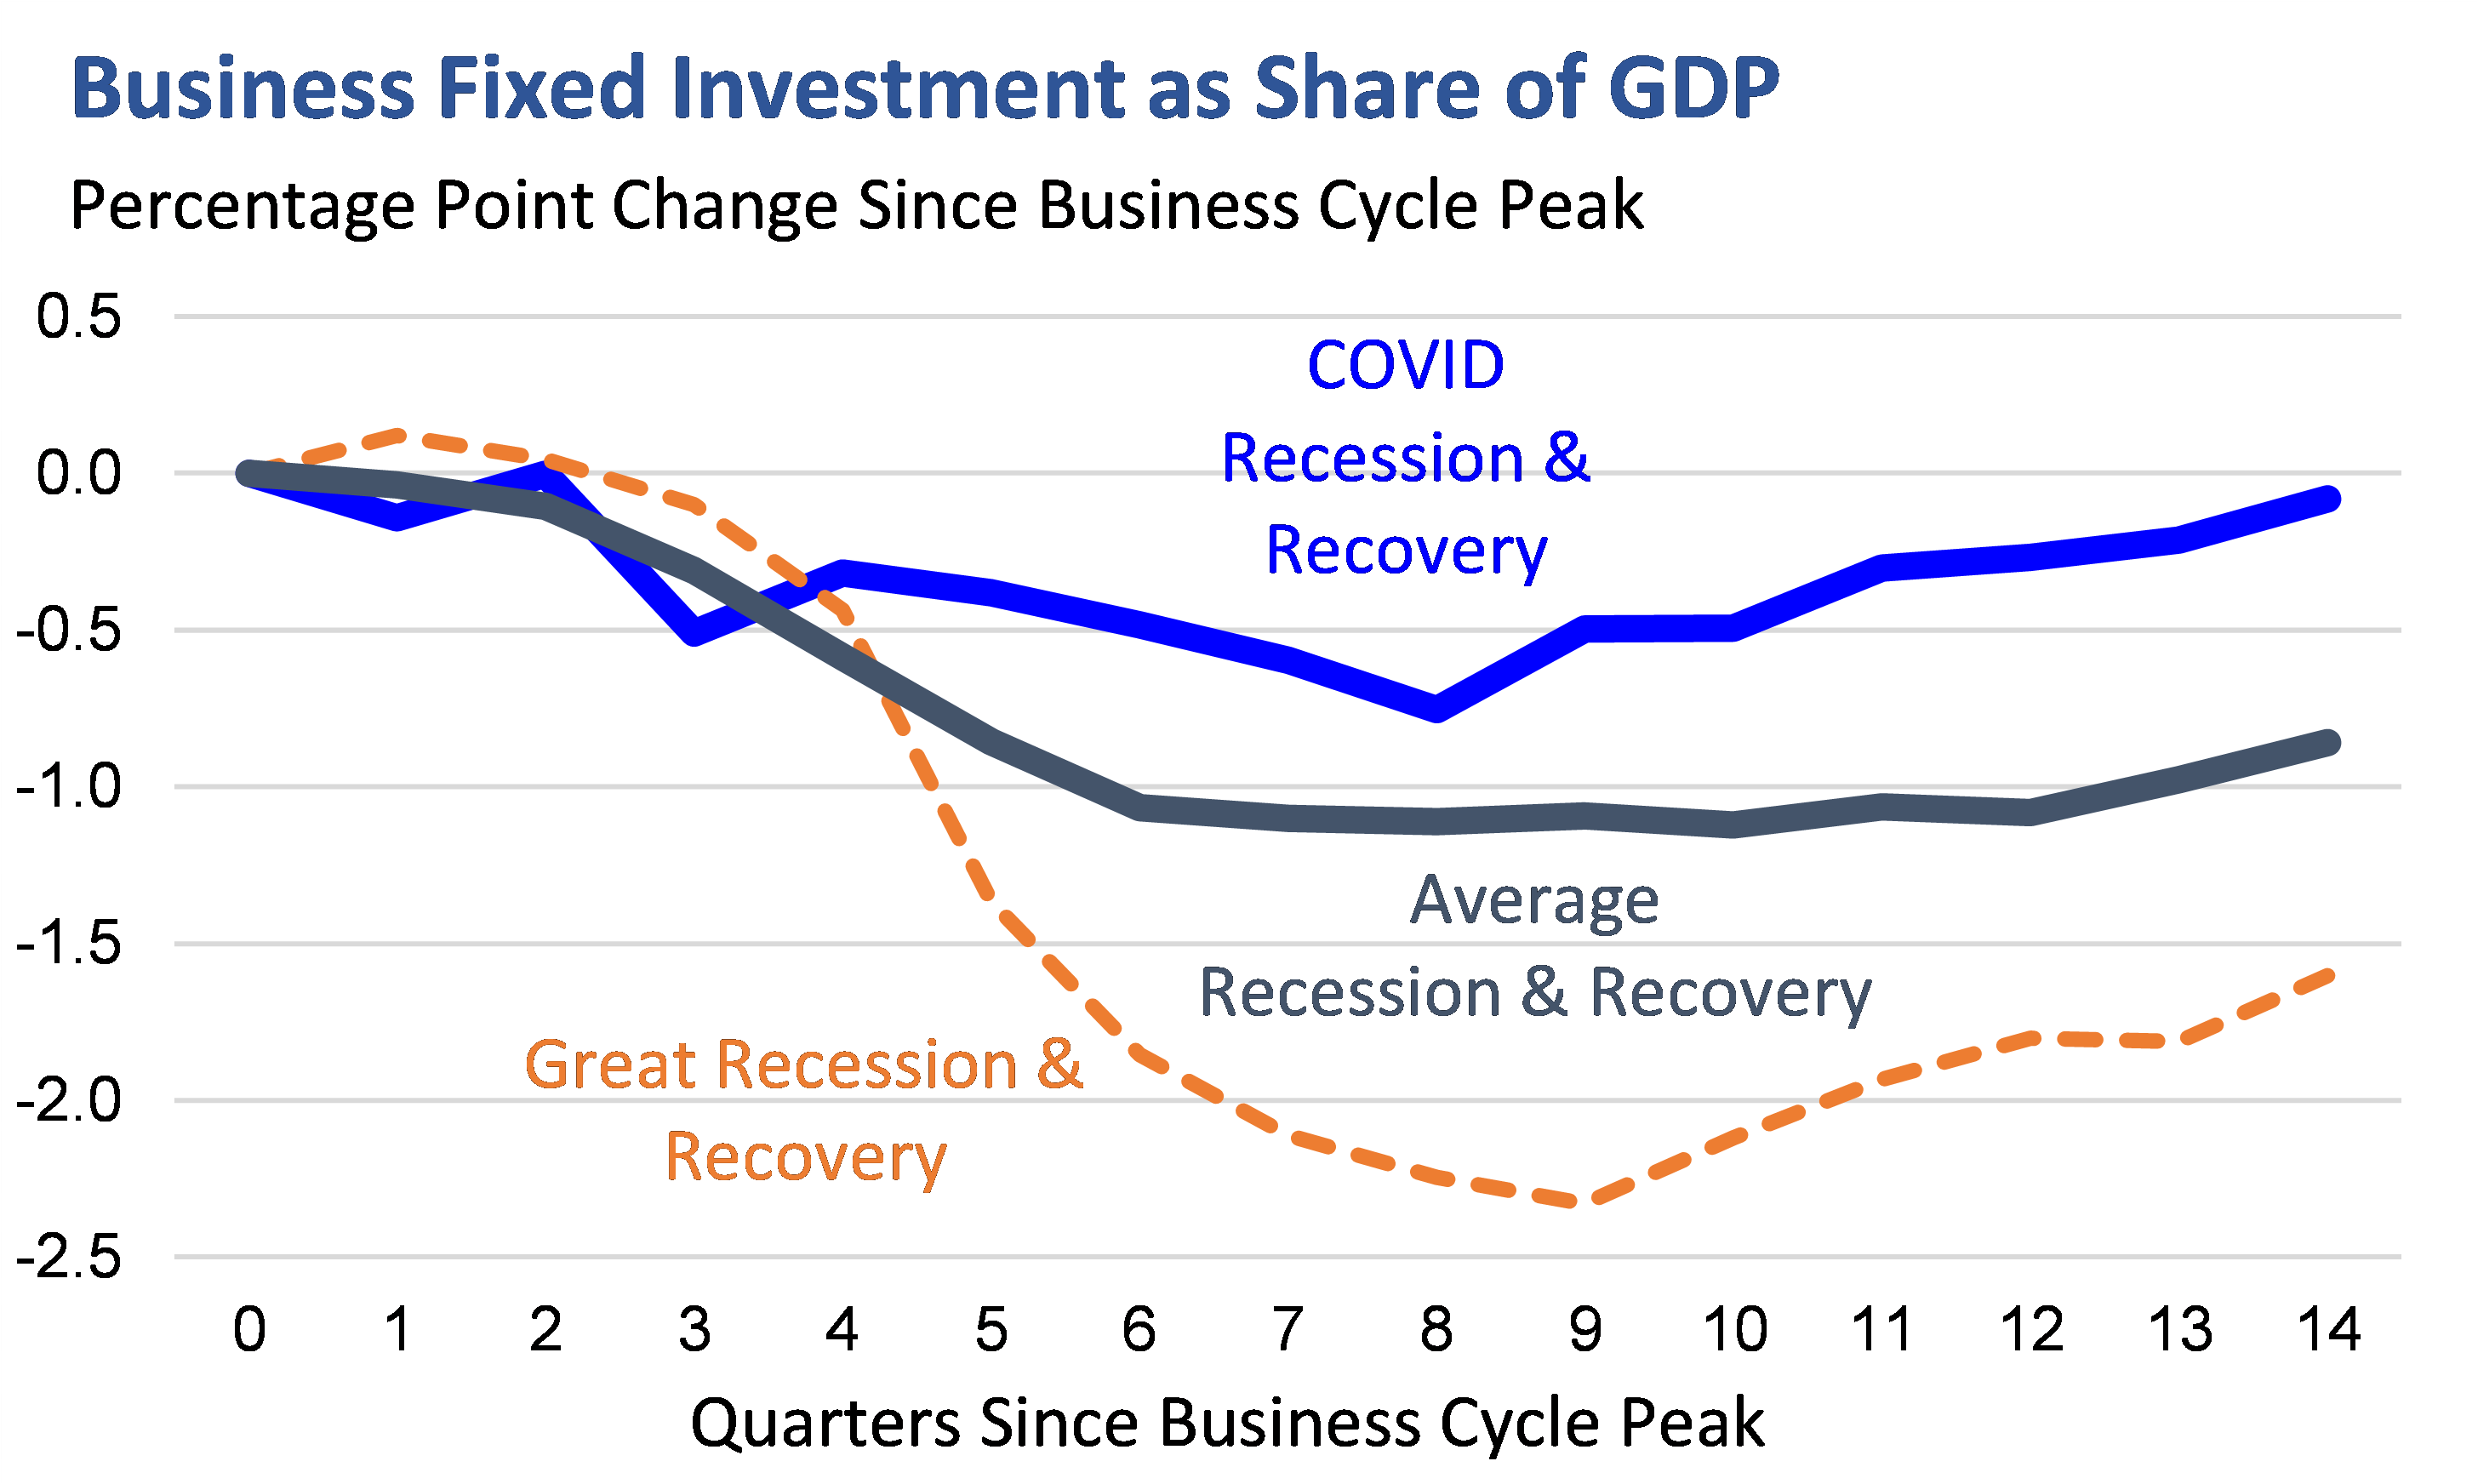
Business Investment in the Post-COVID RecoveryWe begin by reviewing how aggregate private business investment has fared in the recent recovery. Here, there is evidence that private investment has held up especially well in recent years, despite the recent increase in interest rates, which—all else equal—would tend to slow investment rates. Business fixed investment (BFI) is a conventional measure of investment by private companies. Typically, BFI falls at about the same rate as overall GDP during a recession, but then lags other components in the recovery. Therefore, we expect to see BFI’s share of overall GDP fall in the years following a recession. This was especially the case following the 2008 Great Recession, as shown below in Figure 1. But in recent years, BFI has grown much faster than normal at this point in the economic cycle: investment is roughly the same share of GDP as it was just before COVID—a better outcome than after every other recession since 1980. Figure 1
Source: Bureau of Economic Analysis; U.S. Treasury calculations. Business cycle peaks are defined as the final quarter before a recession begins as determined by the National Bureau of Economic Research; all business cycle peaks since 1969 are included in “Average Recession & Recovery.” R&D, an important component of BFI, has been strong in this recovery (Figure 2). Private real R&D investment is 17% higher than when COVID hit; it is typically only 11% higher at this point in the business cycle. At this point following the Great Recession, R&D was only 2% higher than before the recession. Of course, many factors can help account for this strength. But R&D is exactly the sort of investment that modern supply-side economics intends to encourage: investments in new technologies that increase our economy’s long-term growth. Figure 2
Source: Bureau of Economic Analysis; U.S. Treasury calculations. Real R&D investment is expressed in billions of chained dollars as measured in the National Income & Product Accounts, indexed to business cycle peaks as determined by the National Bureau of Economic Research. All business cycle peaks since 1969 are included in “Average Recession & Recovery.” We are seeing strength in business investment in many other sectors as well. By June, real construction of manufacturing facilities had more than doubled since 2021, mainly reflecting new factories in the technology sector (see “Unpacking the Boom in U.S. Construction of Manufacturing Facilities,” June 27).[2] The CHIPS and Science Act’s significant investments in semiconductor manufacturing reflect an important contributor to that trend, just as the IRA’s incentives for clean tech are another important tailwind for business investment. Investing in Clean Technology in Disadvantaged CommunitiesThe IRA is designed to accelerate the development and deployment of clean energy technology that will allow the United States to do its part to help avoid the disastrous effects of climate change. But importantly, making such investments in our manufacturing sector can increase economic returns for economically disadvantaged or struggling communities when the associated job creation occurs within those communities. Such investments help promote equity goals by raising wages in lower-wage communities, and there is also evidence that investment policies enacted in distressed job markets have the highest “bang for the buck.”[3] In fact, for these reasons, the IRA includes important place-based bonuses for locating certain clean energy generation investments in low-income and high-unemployment areas. It is too early to study the effectiveness of the place-based incentives within the IRA, particularly since some are allocated credits that have not yet been awarded. It may be years before we have the data to substantiate a comprehensive causal analysis of the legislation’s effect on investment. Nevertheless, public reports of new investments offer an early clue of the likely effects and the locations where firms are choosing to invest. The Biden-Harris Administration’s Invest.Gov website tracks such announcements since the President took office, including the location of announced investments and the specific industry sector. Invest.Gov identifies over 250 projects reflecting $500 billion in announced investment; notably, almost 150 of those projects, reflecting $200 billion, are in IRA-related sectors of clean energy, electric vehicles, and batteries.[4] These data are clear. We find that counties where investments in IRA-related sectors have been announced tend to be more economically disadvantaged than average. We do not claim that the locations of the investments were chosen due to the design of the IRA, and we are not attempting to identify the reasons behind the location choice. But regardless of the reasons, the fact that IRA-related investments appear to be concentrated in lower-income places suggests that not only will these investments provide opportunity to communities that need it the most, but they will also leverage the most promising regions for national productivity growth.[5] First, IRA-related investments are concentrated in areas where college graduation rates are lower than average. Figure 3 shows that more than 80% of such investments are in counties with lower college graduation rates than the national average. Figure 3
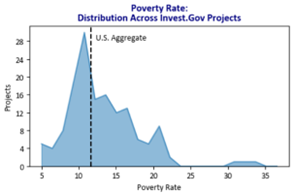
Source: Invest.Gov for investment project locations; U.S. Census Bureau for county-level college graduation rates; U.S. Treasury calculations. Plotted distributions are histograms reflecting the number of projects in each of 20 equally-sized buckets by college graduation rate in the stated county. College graduation rates are as of 2021. Second, Figure 4 shows that about 65% of announced investments are in counties with above-average overall poverty rates. A similar share of announced IRA-related investments are in counties with above-average child poverty rates. Figure 4
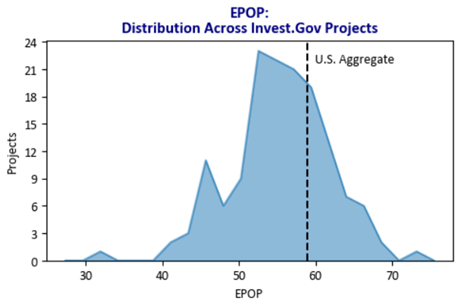
 Source: Invest.Gov for investment project locations; U.S. Census Bureau for county-level poverty rates; U.S. Treasury calculations. Plotted distributions are histograms reflecting the number of projects in each of 20 equally-sized buckets by poverty rate in the stated county. Poverty rates are as of 2021. Third, 65% of announced investments are in counties where a lower-than-normal share of the population is employed. Figure 5 plots those employment-population (“EPOP”) ratios. Figure 5
Source: Invest.Gov for investment project locations; Bureau of Labor Statistics for county-level employment-population ratios; U.S. Treasury calculations. Plotted distributions are histograms reflecting the number of projects in each of 20 equally sized buckets by employment-population ratio in the stated county. Employment-population ratios are 2022 annual averages. These data do not include one announced project in Connecticut due to a recent change in Connecticut’s Census geographic classifications. Perhaps most strikingly, average wages are much lower in counties that have seen IRA-related investment announcements. Figure 6 shows that almost 90% of the announced investments are in counties with below-average weekly wages. Figure 6
Source: Invest.Gov for investment project locations; Quarterly Census of Employment & Wages for county-level average weekly wages; U.S. Treasury calculations. Plotted distributions are histograms reflecting the number of projects in each of 20 equally-sized buckets by average weekly wages in the stated county. Average weekly wages are 2022 annual averages. These communities are poised to reap huge benefits from new investment. New plants could bring people into the labor force who have been left behind. Both of these outcomes would result in higher incomes for people in these communities. Furthermore, the entire country will reap the benefits of a more productive labor force associated with cleaner technology. ConclusionBusiness investment has been especially resilient in the past few years, as companies invest in R&D which helps grow our economy in the long term. The Inflation Reduction Act encourages these investments in clean technology to help reduce global carbon emissions. At the same time that aggregate investment has increased, reported investments in clean energy, electric vehicles, and batteries are being deployed in communities with weaker labor markets and other disadvantages. These investments in long-term growth, which are also targeted at reducing inequality and addressing climate change, are central to modern supply-side economics and to President Biden’s agenda. [1] See, e.g., Patrick Kline and Enrico Moretti, People, Places, and Public Policy: Some Simple Welfare Economics of Local Economic Development Programs, Annual Review of Economics 2014 6:1, 629-662. [2] Total Construction Spending: Manufacturing in the United States (TLMFGCONS) | FRED | St. Louis Fed (stlouisfed.org); Producer Price Index by Commodity: Intermediate Demand by Commodity Type: Materials and Components for Construction (WPUID612) | FRED | St. Louis Fed (stlouisfed.org) [3] Kline and Moretti, 2014; Benjamin Austin, Edward Glaeser, and Lawrence Summers, “Jobs for the Heartland: Place-Based Policies in 21st-Century America,” Brookings Papers on economic Activity, Spring 2018, pp. 151-232. [4] About one-third of the 150 investments in IRA-related sectors were announced prior to the passage of the IRA, and, of these, 20 were made in 2021. We have included these investments in the analysis in this blog post because many firms could plausibly have anticipated the improved policy environment for investment under this Administration due to prior proposals and policy debates. [5] Some commentators have argued that the correlation between income and location choice can be explained by investments occurring in states with policy environments less supportive of unionization than others. However, even in the subset of IRA-related investments in states without “right-to-work” laws, three-quarters of announced investments have below-average wages and below-average college graduation rates—consistent with the distributions discussed here. Back To News |
|