December’s Biggest U.S. Jobs Gains Were in Two Consumer Spending Areas
01/14/2020
[Article was originally posted on www.constructconnect.com]
By: Alex Carrick, A Dampening of Euphoria May Be WarrantedEuphoria concerning the U.S. economy, as demonstrated by record-setting stock market indices, won’t be dampened much by the just-released and somewhat tame Employment Situation report from the Bureau of Labor Statistics. The total number of American jobs in December rose by a lukewarm +145,000. Also, November’s jobs total was revised downwards slightly, by -14,000. 
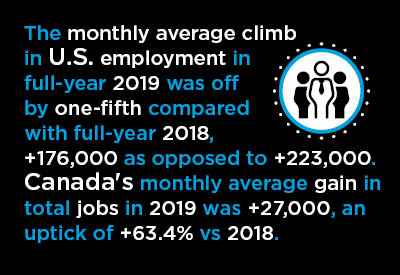
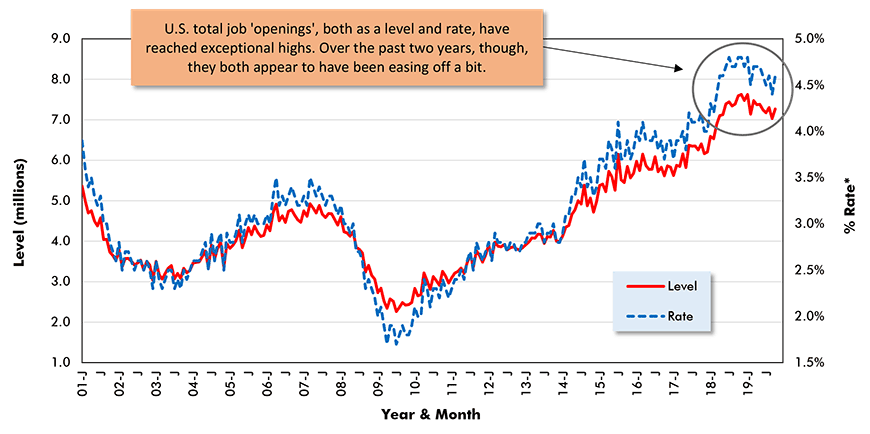
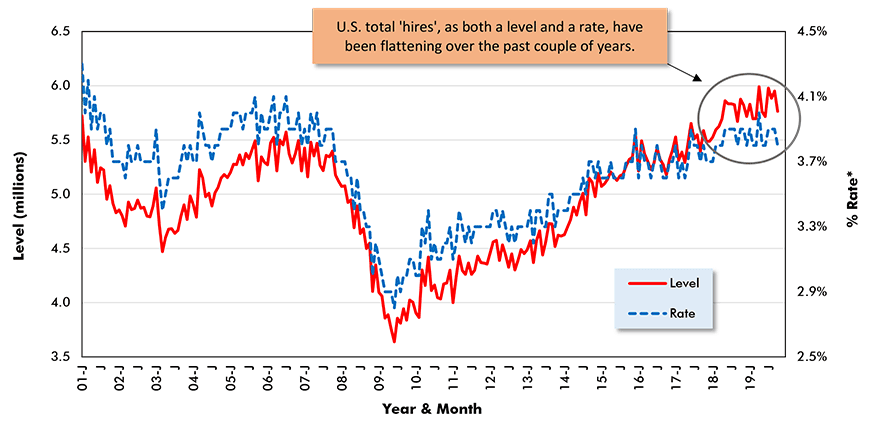
At the same time, though, the seasonally adjusted (SA) unemployment rate stayed constant and exceedingly tight at 3.5%. Nevertheless, the monthly average climb in U.S. employment in full-year 2019 was off by one-fifth compared with full-year 2018, +176,000 as opposed to +223,000. Graphs 1 and 2 have been derived from the Job Openings and Labor Turnover Survey (JOLTS). Graph 1 highlights that while total job ‘openings’ in the U.S. economy, expressed as both a level and a rate, remain quite elevated, they have been easing off a bit over the past couple of years. Also, ‘hires’, as captured in Graph 2, appear to have been moving sideways more than upwards. Consumer Calling the Shots in New EmploymentA historically low unemployment rate will render jobs advances, as seen so far in this economic upturn, harder to achieve. In turn, slower employment pickups will lead to a deceleration in consumer spending growth. For the moment, though, ‘the consumer’ is still calling most of the shots in the economy, even in the labor market. For example, the biggest climbs in U.S. jobs among industry sub-sectors in December occurred in the consumer spending area. ‘Retail’ jobs in the latest month were +41,000. ‘Leisure and hospitality’ jobs weren’t far behind at +40,000. ‘Education and health services,’ a jobs-creating front-runner in many recent months, had an employment gain in December of +36,000. Construction came in at +20,000, a decent enough jog upwards, but manufacturing was a disappointment, at -12,000. U.S. construction’s monthly average jobs increase in 2019 was +13,000, which was only half of the sector’s 2018 performance of +26,000. Still, construction fared far better in 2019 than manufacturing, where the average monthly jobs pickup plummeted to just +4,000 from +22,000 in the preceding annual period. Graph 1: U.S. Total Job Openings (from JOLTS Report) 
*Rate is number of job openings end-of-month as % of 'construction employment plus number of job openings'.
Data Source: Bureau of Labor Statistics (BLS). Graph 2: U.S. Total Job Hires (from JOLTS Report) 
*Rate is number of hires during month as % of construction employment.
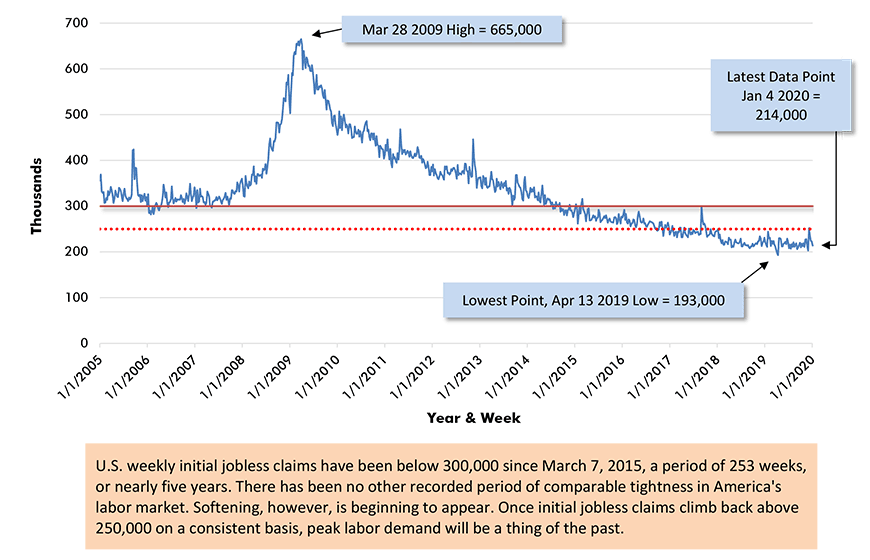
Data Source: Bureau of Labor Statistics (BLS). Wage Growth Still Loping Rather Than Sprinting AlongDespite negligible unemployment in the U.S. economy, earnings aren’t showing much life. For ‘all jobs’ (and including supervisors) in December, wages rose +2.9% y/y hourly and +2.3% y/y weekly. For ‘all jobs’ (but excluding supervisors), wages moved upwards by +3.0% y/y hourly and +2.4% y/y weekly. The compensation increases for construction workers were worse on all four counts. Including supervisors, ‘hard hat’ workers saw wages in the last month of 2019 that were +2.3% y/y hourly and +1.0% y/y weekly. Leaving out bosses, ‘hard hat’ workers experienced earnings climbs that were only +2.0% y/y hourly and +0.7% y/y weekly. Graph 3: U.S. Initial Jobless Claims Weekly 
Data Source: Department of Labor. Canada Had Huge Jobs-Creation Year in 2019North of the border, the increase in total employment in December, as reported by Statistics Canada, was +35,000. The good news was further augmented by a drop in the SA unemployment rate from 5.9% to 5.6%. Canada achieved a strong record of jobs creation in 2019. The nation’s monthly average gain in total jobs was +27,000, an uptick of nearly two-thirds (+63.4%) compared with 2018’s comparable figure of +16,000. Canadian construction employment ended the latest month higher by +17,000 jobs. But on a monthly average basis throughout 2019, construction contributed only +2,000 jobs, marginally above 2018’s +1,000. The bottom line is that construction employment in Canada has remained nearly flat for several years. On a year-over-year percentage-change basis, four of Canada’s key job-creation metrics have been: ‘total’ jobs, +1.7% (versus +1.4% in the U.S.); ‘services-providing’ jobs, +2.5% (versus +1.7% in the U.S.); ‘manufacturing’ jobs, -2.3% (versus +0.4% in U.S.); and ‘construction’ jobs, +2.0% (the same rate of increase as in the U.S.).
During 2019, Canada’s total jobs count rose by +320,000. An astonishing 96% of that increase originated in either Quebec or Ontario. While Quebec contributed one-fifth of the gain, it was Ontario that really stepped into the spotlight. Ontario generated more than three-quarters (76%) of Canada’s impressive total employment gain in 2019. Back To News |
|
|
|
ABOUT SBE Inc.
Small Business Exchange Inc., is the ultimate business information hub for small businesses, disadvantaged, Asian, Black, Hispanic Women and Disabled Western-owned Business. Founded in 1984 by Gerald W. Johnson and Valerie, Voorhies, SBE, has been working for over two decades to provide businesses with the most powerful tools available and accurate, up-to-date information about contract opportunities in the public and private marketplaces. CONTACT
Small Business Exchange, Inc.
Phone: 415-778-6250
© 2025 Small Business Exchange, Inc.
|
||
|
|
December’s Biggest U.S. Jobs Gains Were in Two Consumer Spending AreasBack To News |
|


