|
|
Mid-April Economic Nuggets – With an Emphasis on Rules of Thumb
04/22/2019
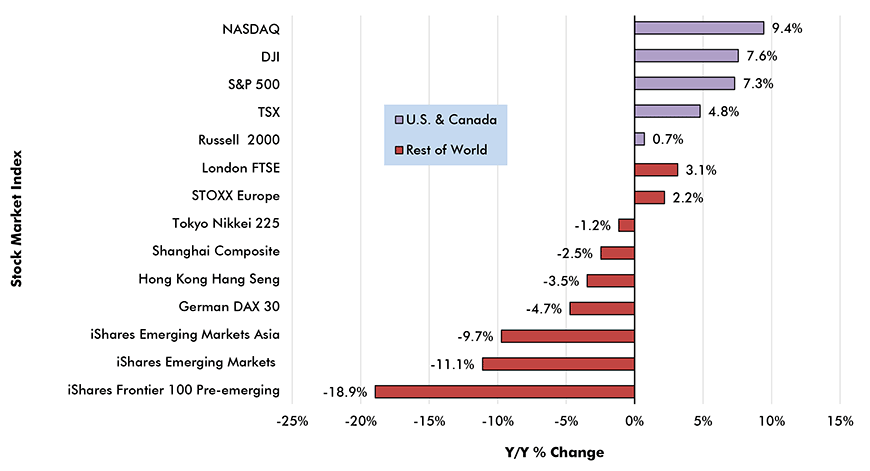
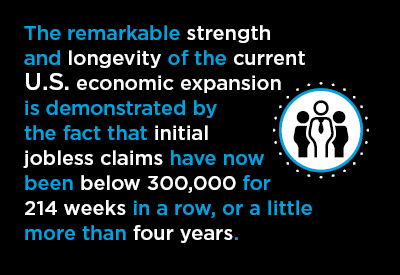
As 2018 wound down, yields appeared set for further hikes. Share prices, homebuilding, and general spending levels all reacted negatively. Optimism in the economy faltered. Now that a pause has been placed on interest rate increases, however, the prevailing mood has turned chipper once again. Lurking in the background, though, is a perhaps dangerous degree of denial. When this era of excessively low interest rates comes to an end, which it must eventually, although not if President Trump has his say, heavily burdened debtors among homeowners, car purchasers, corporations, and governments will be plunged into severe carrying-cost woes. Anyway, for now, the U.S. economy is doing great (with Canada trailing a bit) and below are some of the highlights/nuggets from recent public and private sector data releases. In several instances, ‘rules of thumb’ are cited for key metrics and their standards of performance. Initial Jobless ClaimsThe earliest warning sign of any softening in demand for U.S. workers will almost certainly appear in the initial jobless claims numbers issued by the Department of Labor (DOL). For starters, initial jobless claims are monitored weekly, whereas other data on jobs growth and unemployment are measured monthly. Prior to the recession, a figure as low as 300,000 for initial jobless claims was considered commendable. In the middle of the recession, they shot up to nearly 670,000. It was another five years before they dropped back down to again touch 300,000. The remarkable strength and longevity of the current U.S. economic expansion is demonstrated by the fact that initial jobless claims have now been below 300,000 for 214 weeks in a row, or a little more than four years. Nor are they giving any indication of worsening. A level of 300,000 as a benchmark of health has just given way to 200,000. For the week ending April 6th, initial jobless claims reached a mere 196,000, their best level since December 6 1969’s 193,000. The last month of the ‘Swinging Sixties’ was nearly 50 years (i.e., half a century) ago. Stock Market ActivitySometimes there’s a graph so perfect, it leaves an economist breathless. Graph 1 below is such a chart. It provides the plainest possible evidence that North America has been the source of whatever economic momentum there has been in the world. The purple-shaded indices are derived from listings of companies that are mainly based in the U.S. (DJI, S&P 500, NASDAQ and Russell 2000) or Canada (TSX). The other nine indices measure the stock performances of companies in Europe, Japan, China, Latin America, Africa and elsewhere. Almost all the fastest rising indices over the past year have been North American. The indices from the rest of the world have mainly been in decline.
Graph 1: Stock Market Performances: U.S. & Canada vs Rest of World 
iShares is a web site that specializes in “exchange traded funds”, or ETFs, managed by BlackRock Investments LLC.
Data source: ‘finance.yahoo.com’ /Chart: ConstructConnect.
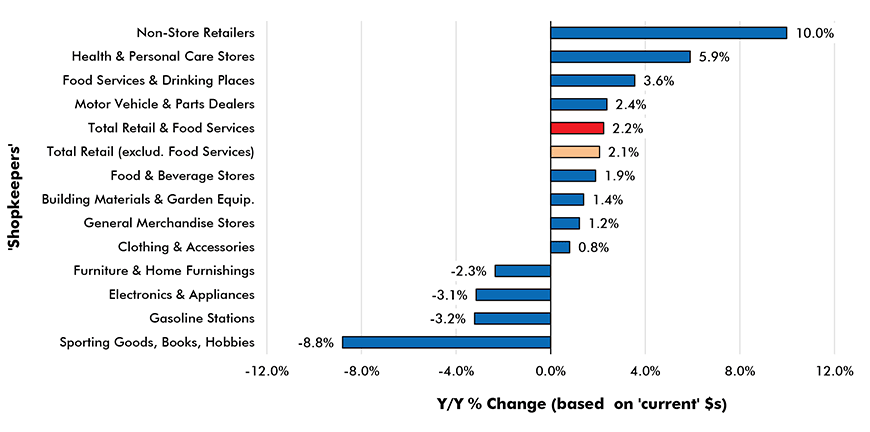
The end data points for the year-over-year calculations in Graph 1 are ‘as of closing’ March 29, 2019. There have been further upward shifts through the first two weeks of April. NASDAQ has risen by another +3.3%; the S&P 500, +2.6%; TSX, +2.4%; and DJI, +1.9%. The DJI, S&P 500, and NASDAQ, after briefly sinking into the doldrums in late 2018, have all recovered near their all-time peaks. The S&P 500 is closest. It would need a further lift of only +1% to match its former summit. The DJI and NASDAQ require additional gains of +2%. U.S. Retail SalesWhen inflation, as determined by the Consumer Price Index (CPI), is running near its target of +2.0% year over year – which, by the way, is the case at present − economists like to see retail sales growth be +5.0% year over year or more. U.S. retail sales, as calculated by the Census Bureau, are in ‘current’ dollars. Eliminating price effects will reduce a +5% gain to +3% in ‘constant’ dollar terms. In turn, +3.0% for ‘real’ retail sales will provide a big boost to ‘real’ gross domestic product (GDP). Consumer spending accounts for roughly 70% of U.S. GDP and retail sales are at least 40% of personal consumption expenditures (PCE). Graph 2: U.S. Retail Sales, Year over Year (Y/Y) − February 2019 
Data source: U.S. Census Bureau/Chart: ConstructConnect.
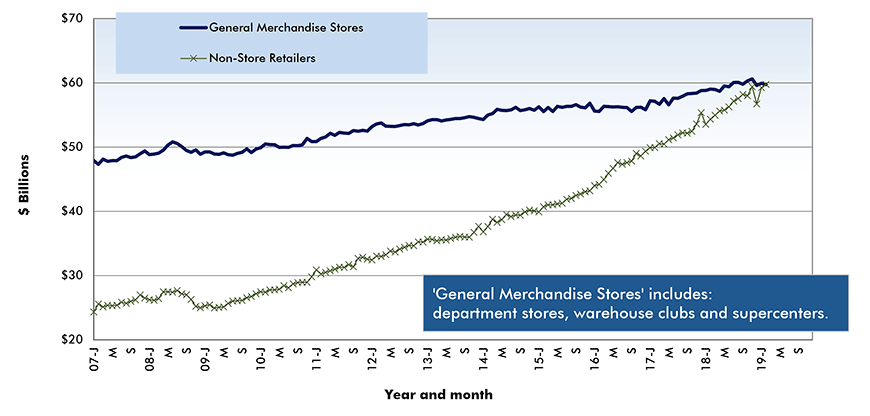
With +5.0% year over year as a desirable yardstick, U.S. retail sales in the latest month for which data is available, February 2019, disappointed. They were only +2.1% (see Graph 2), and even if the negative impact of gasoline sales is omitted, they were just +2.6%. Over the past year, gasoline sales have been dragged down by a price decline. That effect has been gradually dissipating. March’s U.S. CPI results have gasoline nearly flat, -0.7% year over year. Motor Vehicle and Online Retail SalesFor much of the post-recession period, total retail sales have been bolstered by ‘motor vehicle and parts’ sales. The automotive segment traditionally approaches one-quarter of total retail. February’s sales by motor vehicle and parts dealers were okay, but not outstanding, +2.4% year over year. If you’re looking for excitement in retail sales, ‘nonstore’ merchandising continues to provide the most sizzle. In February, online auction and Internet platform sales were +10.0% year over year. Graph 3 highlights the determined and ultimately successful pursuit of general merchandise stores by nonstore retailers.
Graph 3: U.S. Monthly Sales by General Merchandise Stores vs 
Adjusted for seasonal variation, holiday and trading day differences, but not for price changes.
Latest data points are for February 2019.
Data source: U.S. Census Bureau (Department of Commerce)/Chart: ConstructConnect.
Furthermore, the merchandise store component of retail hasn’t been entirely paralyzed by the digital onslaught. It has fought back with warehouse clubs and supercenters. Ongoing carnage in other pockets of ‘bricks and mortar’ retail, however, is apparent. Signal Jewelers, the corporate owner of Kay Jewelers, recently announced it will be closing 150 mall locations over the next couple of years. Bed, Bath & Beyond is planning to shutter 40 stores in fiscal 2019, although it has been quick to add that it will also open 15 new sites. Canadian Housing StartsFor years, monthly Canadian housing starts have hovered around 200,000 units, seasonally adjusted and annualized (SAAR). Therefore, it was with some alarm that February 2019’s figure of a measly 166,000 units was greeted. But in March, according to Canada Mortgage and Housing Corporation (CMHC), there was a bounce back, to 193,000 units.
Among Canada’s six most populous cities (i.e., those with more than a million residents each), Ottawa was the hot home construction market in Q1. The year-over-year percentage change in residential groundbreakings in the nation’s capital so far this year has been +44%, with multiple-unit initiations up considerably, +76%, but singles down, -19%. Montreal, at +14%, has also achieved an increase in housing starts in 2019 to date, but the other four major urban areas have backtracked: Calgary, -12%; Edmonton, -13%; Vancouver, -16%; and Toronto, -37%. Back To News |
|


