[ Article was originally posted on www.constructconnect.com ]
By: Alex Carrick,
In the Big Apple, 81% of New Home Starts are Multiples
There are 50-plus U.S. metro statistical areas with populations of more than one million. In most those cities, single-family housing starts still account for a larger share of total unit starts than multiples. (The latter are mostly to be found in condo and apartment towers.)
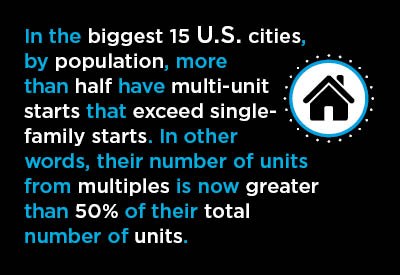
But in the biggest 15 cities, by population, more than half have multi-unit starts that exceed single-family starts. In other words, their number of units from multiples is now greater than 50% of their total number of units.
The statistics are based on residential building permits, but it is generally accepted by the analytics community that the words ‘permits’ and ‘starts’ can be used interchangeably.
Last year, in America’s three most populous cities, the shares of total units made up of multiples were as follows: New York, 81%; Los Angeles, 69%; and Chicago, 58%.
By the way, the Big Apple with a multiples-to-total ratio of 81% is, by far, the city in the U.S. with the most intense high-rise residential construction.
There’s another feature of those three cities that really stands out, though. In the latest annual period for which statistics are available, July 1, 2017 to July 1, 2018, they all recorded small declines in number of residents. N.Y. and L.A. were each -0.1% and Chicago, -0.2%.
Therefore, it’s more interesting to look at four cities, within the Top 15 for population, where not only are multiples a bigger share of the total, but where population is also on the rise.
Furthermore, it’s not just a coincidence that those four cities ? Boston, San Francisco, Seattle, and Washington, D.C. (two on the East Coast and two on the West Coast) ? are also high-tech and academic hubs. Their intellectual bona fides help attract fresh new streams of talent.
Multis Surpass Singles in Boston for 8 Straight Years
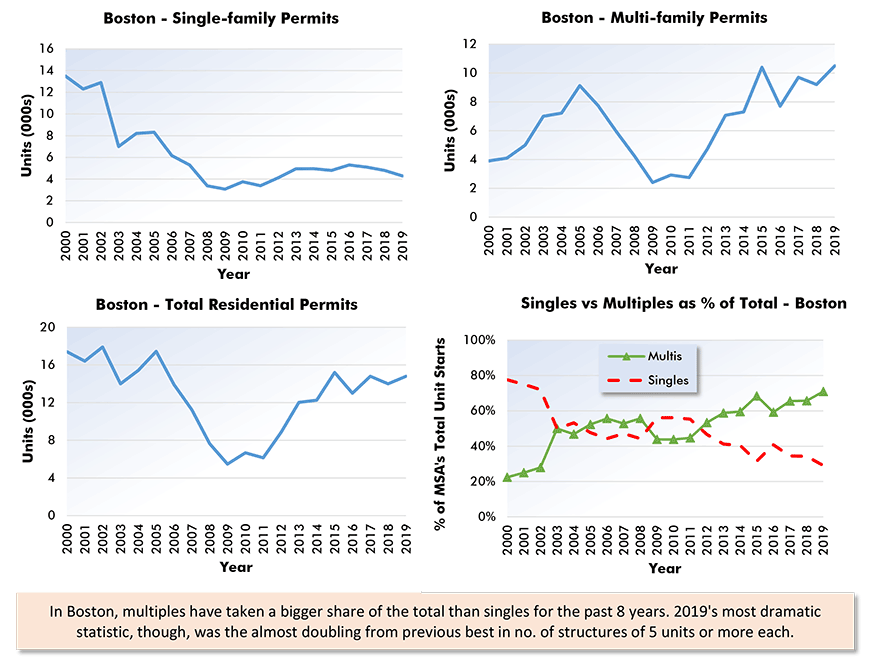
Chart 1 highlights that single-family construction in the Boston MSA sank dramatically throughout the 00s and has not recovered since. But multi-family construction has shot up nicely since the 2008-09 recession.
Multis as a share of total housing starts in Boston have exceeded singles for the past eight years. The proportion of multis-to-total has gradually, but mostly steadily (except in 2016), climbed to the point where it is now 71%.
It will be shown in the next section that 71% as a share-of-total for multis is the same as in San Francisco.
Boston picked up an additional 31,000 residents in the latest year for which data is available, an annual gain of +0.6%.
Boston’s total residential unit permits or starts in 2019 compared with 2018 were +6.0% (i.e., 14,780 versus 13,970).
Graph 1: Boston-Cambridge-Newton Residential Building Permits
'Residential permit' numbers serve as a proxy for 'housing starts'.
Data source: Census Bureau and National Association of Home Builders (NAHB).
Chart: ConstructConnect.
In San Francisco, Multis Ahead of Singles in 13 of Past 14 Years
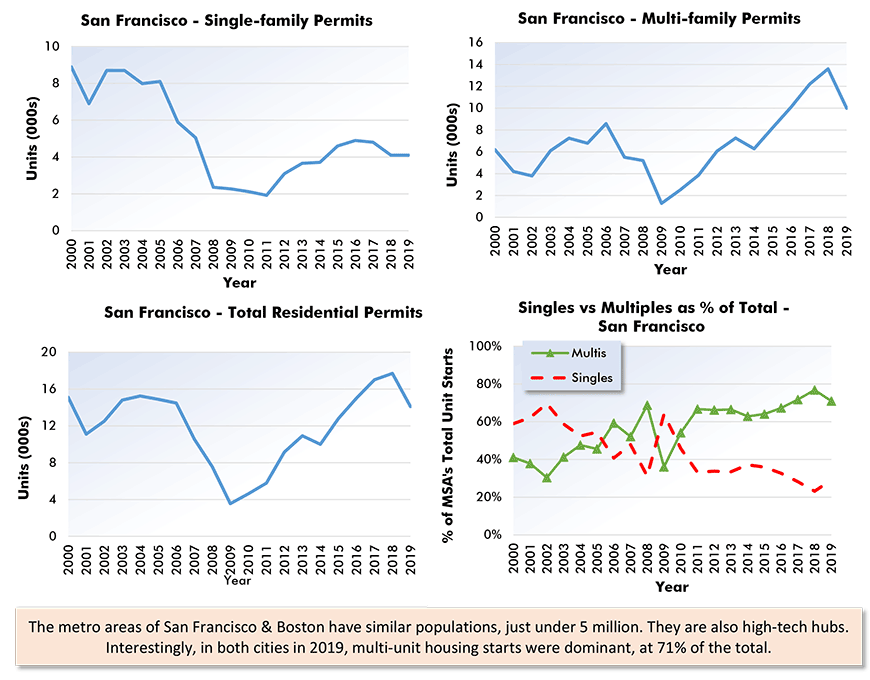
San Francisco recorded a 20% drop in total new home starts in 2019 versus 2018. The exceptionally high cost of housing in The Bay area is scaring away buyers.
According to the National Association of Realtors (NAR), the median (i.e., with half lower and half higher) price tag on an existing single-family home in San Francisco in the fourth quarter of 2019 was $990,000, second dearest in the country behind San Jose’s $1.2 million. Boston’s comparable figure, at $483,000, was half as much.
San Francisco, which ranks 12th in the nation for population, was positioned 24th for total number of housing starts (14,100 units) last year. Just ahead of San Francisco in the ‘starts’ ranking was Boston (14,800 units), in 23rd spot.
San Francisco’s population rose by +0.4% between mid-2017 and mid-2018, which translates to an extra +19,000 people.
The green and red bottom-right-hand curves in Chart 2 shine a spotlight on the most noteworthy aspect of San Francisco’s homebuilding scene. In 13 of the past 14 years, with the recession year of 2009 as the only exception, multi-unit residential construction has beaten single-family construction, as a share of total.
The percentage share for multis in San Francisco-Oakland-Hayward climbed to nearly 80% in 2018. In 2019, it slipped a little to 71%.
Graph 2: San Francisco-Oakland-Hayward Residential Building Permits
'Residential permit' numbers serve as a proxy for 'housing starts'.
Data source: Census Bureau and National Association of Home Builders (NAHB).
Chart: ConstructConnect.
Multiples 60% or More of Total Units in Seattle for Latest 6 Years
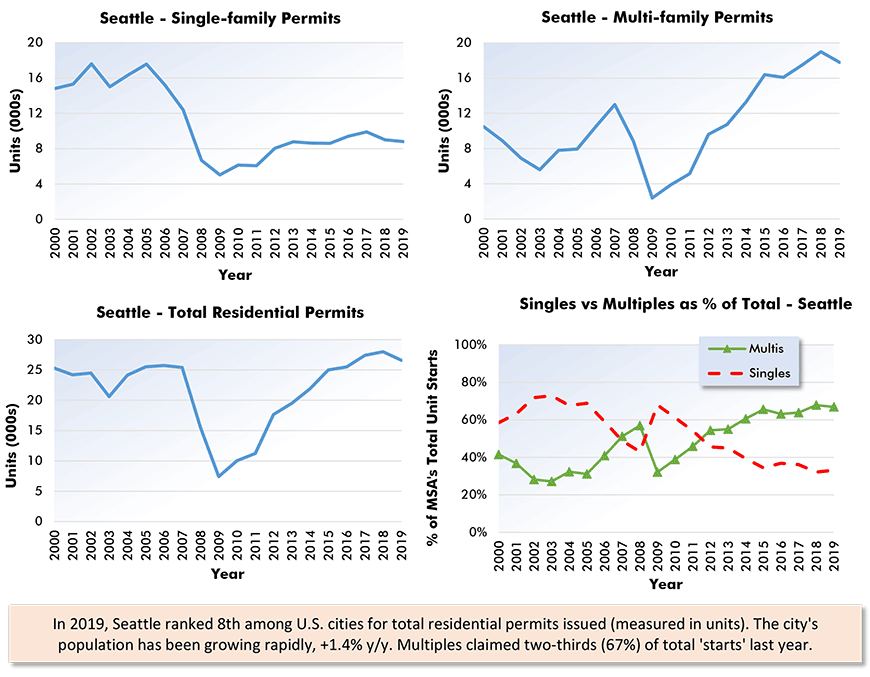
Seattle, 15th among U.S. cities for population, held an 8th place ranking for total residential unit starts (26,600) in 2019. The city’s 8th place finish was accomplished despite a -5% pullback in total unit permits.
Acting as home base for many of the newly iconic and rapidly growing firms in the digital world, Seattle has been seeing torrid population growth ? e.g., +1.4% in 2018. The +1.4% figure represented a net climb of +55,000 individuals.
From mid-2017 to mid-2018, Seattle (+55,000 people) was 6th among U.S. MSAs for nominal population increase. Positions one through five were filled by: Dallas-Ft Worth, +132,000; Phoenix, +96,000; Houston, +92,000; Atlanta, +76,000; and Orlando, +60,000.
From Chart 3, Seattle has seen steeply climbing starts in the ‘multiple-units’ category that stand in sharp contrast with a tepid advance in ‘singles’ since the 2008-09 recession. As a result, multiples as a share of the total in the city have been 60% or more in the latest six years.
In 2019, permits for multiples in units were two-thirds (67%) of total residential units authorized.
Graph 3: Seattle-Tacoma-Bellevue Residential Building Permits
'Residential permit' numbers serve as a proxy for 'housing starts'.
Data source: Census Bureau and National Association of Home Builders (NAHB).
Chart: ConstructConnect.
Washington Can’t Make Up its Mind, Singles vs Multiples
Returning from the Pacific Coast back to the Atlantic Coast, there’s one final big-population city to consider, Washington D.C. Filled to overflowing with defense contractors, government agencies, private sector think tanks and, around its northern fringe (Loudoun County), with immense data centers, the nation’s capital is a magnet for the ‘best and the brightest.’
In the latest annual period for which statistics are available, Washington’s population rose by +0.8% y/y, or +50,000 persons.
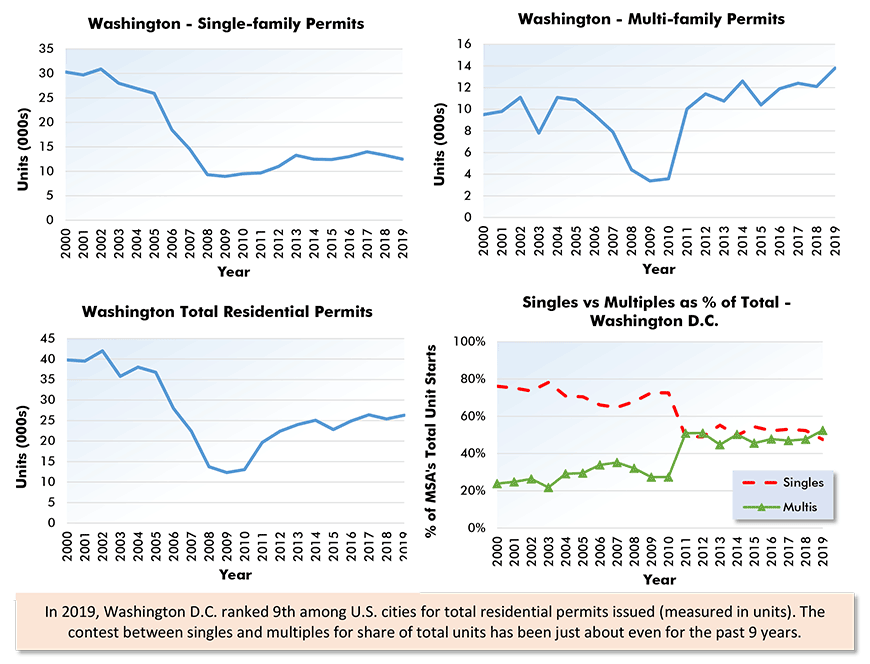
The city ranked 9th for total residential unit starts (26,300) in 2019, which was +3% compared with 2018.
As the bottom right quadrant of Chart 4 illustrates, a dramatic moment arrived in Washington’s residential construction marketplace in 2011. Prior to 2011, singles had been the obviously dominant form of new home building in the city. Then suddenly there was equality.
Ever since, it’s been a toss-up whether singles or multiples would prevail. Last year, multiples were slightly ahead with a 52% slice of total residential unit starts.
Mention was made earlier of single-family resale house prices, as compiled by the NAR. For the record, Q4 2019 median price levels in Seattle and Washington, at $529,000 and $436,000 were in the same ballpark as Boston ($483,000), but they were far outdistanced by San Francisco ($990,000).
The significance of the singles versus multiples question largely lies in the knock-on effects for other kinds of construction. Singles imply suburban growth and the need for roads, sewers, malls and social services infrastructure. Multiples are more a spur to rapid transit and renovation work.
This issue is outlined more fully under the sub-heading Ripple Effects from Singles versus Multiples within the article entitled 3 Texas and 3 Florida Home Construction Hotbeds, accessible through clicking on the following link.
Graph 4: Washington-Arlington-Alexandria Residential Building Permits
'Residential permit' numbers serve as a proxy for 'housing starts'.
Data source: Census Bureau and National Association of Home Builders (NAHB).
Chart: ConstructConnect.


